The fit-for-purpose CGIAR Evaluation Framework and revised Evaluation Policy aim to support the evolving needs and demands of CGIAR in transformation, as stated in the 2030 CGIAR Research and Innovation Strategy and accompanying Performance and Results Management Framework. Consistent with the Quality of Research for Development (QoR4D) framework, one of the six evaluation criteria found in the Policy is Quality of Science (QoS). In process and performance evaluations, among other evaluation criteria, such dimensions as research inputs, processes, and outputs would be analyzed towards evaluating QoS. Given the amplitude of aspects covered by QoS, a range of different methods and tools is required; many relying on CGIAR-wide monitoring, evaluation, and learning (MEL) systems. This guest blog explains how network analysis can complement other methods and metrics used to monitor and assess the QoS. The example shows how integrating different dimensions like geographical focus, gender and duration of the collaborations and bibliometrics into the network analysis, brings value to analyzing the QoS inputs and processes, under the QoR4D.
Monitoring evolution in CGIAR research collaboration network
Engaging in collaborations is beneficial for scientific discovery and accelerating science leading to impact (Fortunato et al., 2018). Multidisciplinary science is particularly crucial especially in agricultural research for development (AR4D), which aims to achieve the Sustainable Development Goals (SDGs). In this context, CGIAR is a unique international research community developing innovations and working locally to make research demand driven.
In 2021, the International Center for Agricultural Research in Dry Areas (ICARDA), CGIAR Research Programs on Grain Legumes and Dryland Cereals (GLDC) and Roots, Tubers and Bananas (RTB), and the University of Florida (UF) teamed up to analyze the collaboration networks occurring within each of the two CGIAR Research Program. The work aimed to explore the potential of using network analysis to understand existing data and support decision-making for One CGIAR. Discussions related to this study were shared during the development of the recently published technical note ‘Bibliometric Analysis to Evaluate Quality of Science in the Context of One CGIAR’ developed by Science-Metrix and CGIAR Advisory Services (CAS) Secretariat Evaluation Function.
During the study, we asked ourselves: how can we best visualize and describe the networks of GLDC and RTB based on the metadata from their published journal articles? What would these networks look like? Is there evidence about the influence of internal organizational structures in these networks? These and other questions are addressed while exploring the scientific collaborations and team composition, based on peer-reviewed journal articles and organizational structures in the two selected Programs from 2017-2018 throughout the end of 2020.
The study uses three primary data sources: CGIAR Results Dashboard, for the list of publications; the Monitoring, Learning and Monitoring Platform (MEL), for information linking publications to Program organizational structures and publication metadata; and the Web of Science, to complement publication metadata with article citations, a bibliometric indicator.
Study methods are related to impact network analysis (INA) (Garrett, 2021), a tool applied in RTB for studying seed systems and epidemic management strategies. INA evaluates linked networks of agricultural decision-makers and networks of farms through which good or bad organisms can spread, for example, improved varieties or crop pathogens. The team, including at UF Aaron Plex Sulá, Berea Etherton and Yanru Xing, applied novel approaches in the study of the collaboration networks. These included models from machine learning to predict collaboration performance, based on variables extracted from journal article metadata and evaluated as potential predictors for two common article-level metrics: number of citations and journal article attention scores. Moreover, for this study, we employed the Monitoring, Evaluation, and Learning Quality Assurance Processor (M-QAP), a tool recently developed to support and assure the quality of the process for data validation and metadata collection on journal articles.
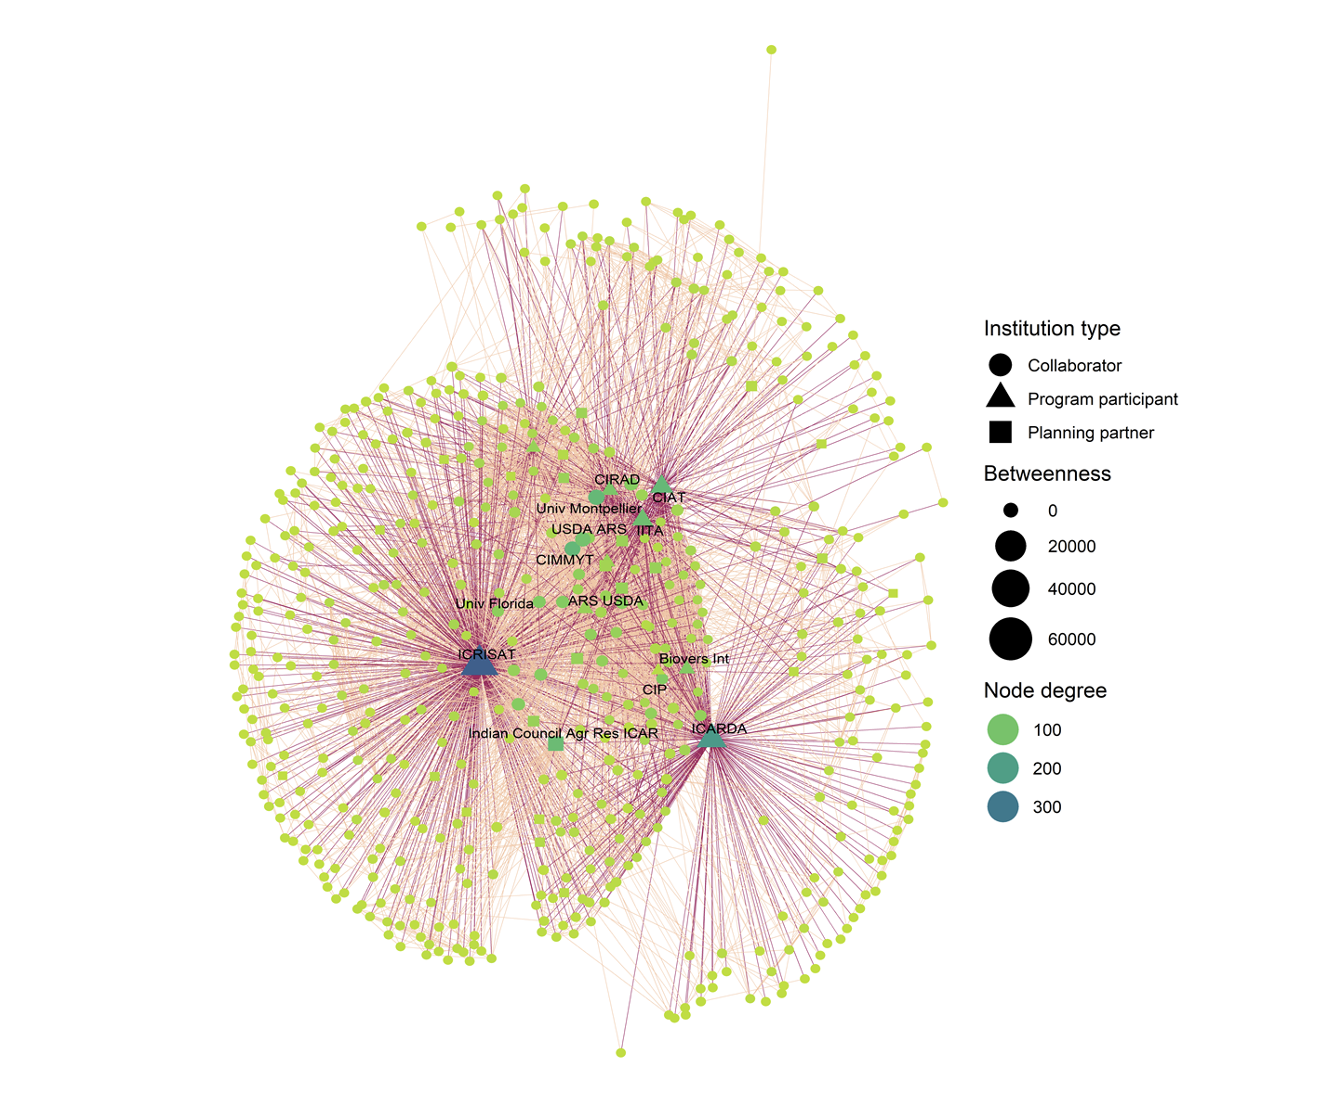
As a sneak preview while the study is being finalized, below is one research collaboration network for GLDC. Metrics such as institution node degree highlight the relative importance of specific nodes, as indicated by node size, in this case for institutions, with the other nodes in the network. Preliminary results show high connectivity and cohesion of institutional collaboration networks in both Programs. Still, we have observed some differences in network roles when looking at the country collaboration networks, gender collaboration and co-authorship networks.
This work only touched on the relevance, legitimacy and scientific credibility of publications, however, we believe that network analysis approaches can go hand-in-hand with other methods and metrics to monitor and assess dimension of the Quality of Science (QoS). Other different dimensions such as geographical focus, gender and duration of the collaborations were integrated into the network analysis. Integration of bibliometrics was only considered using citations as one journal-based metric and Altmetrics to gauge the attention on social media. Further analysis can expand to include other bibliometric indicators such as impact factor, journal citation report quartiles and keywords co-occurrence, similarly as exemplified in Rünzel et al. (2021) – the evaluative review of twelve CGIAR Research Programs, where, for the first time, the Quality of Research for Development (QoR4D) frame of reference has been utilized across the entire CGIAR Portfolio.
During the data collection process for this study, we reflected on the importance of a systemic metadata curation process for CGIAR data, which is crucial to have better data quality and more comparable evaluations. For future studies and evaluations, this could be improved combining, for instance, information from Management Information Systems (MISes) platforms such as MEL and MARLO (Managing Agricultural Research for Learning and Outcomes) with institutional repositories (e.g., MELSpace, CGSpace, Ebrary) and automating and integrating retrievals from other databases (e.g., Web of Science, Scopus, Unpaywall, Altmetric) into existing services. We have also agreed that accessible data of good quality is crucial since data harmonization is pivotal to assessing the effectiveness of CGIAR’s efforts in agricultural research for development.
This network analysis also illustrates how selected recommendations from the technical note can be operationalized, namely related to program data, the use of bibliometrics and information related to Program structure such as Flagships and Clusters of Activities. Furthermore, we believe that network analysis studies such as this one have the potential to add value to the common MEL toolbox, towards improving the understanding of the dynamics and performance of the collaborations produced by research efforts and CGIAR investments.
Finally, we found that the recommendations from Science-Metrics and CAS technical note had the potential to increase the depth of future analysis on performance and impact of research management decisions. First, a funding acknowledgement clearly specified in each journal article would help the traceability from the journal article to the funding sources and lead to more complete analysis and comparison between CGIAR Research Centers, former Programs and new CGIAR Initiatives and Action Areas. Secondly, although challenging, comparative assessments of CGIAR research against external institutions performing AR4D would offer a valuable opportunity for building comparisons for the analysis and cue to reflect on the research practice or collaboration dynamics that need improvements or intervention.
Keep following ICARDA and CAS/Evaluation for more updates.
Figure. Research network of institutions linked with the GLDC research program through co-authorship of journal articles published in 2018-2020 in Phase II. Nodes represent institutions and links represent co-authorship of institution members. The darker the node color, the higher the institution node degree, meaning the institution has a higher number of connections with the other institutions in the network. The node size represents the institution betweenness centrality, which is a measure of a node's importance within the network. The institution name is included for nodes with an institution node degree greater than 75 collaborations. Darker pink links represent articles resulting from collaborations with CGIAR centers.
References:
Garrett, K. A. (2021). Impact network analysis and the INA R package: Decision support for regional management interventions. Methods in Ecology and Evolution, 12(9), 1634–1647. https://doi.org/10.1111/2041-210X.13655
Fortunato, S., Bergstrom, C. T., Börner, K., Evans, J. A., Helbing, D., Milojević, S., Petersen, A. M., Radicchi, F., Sinatra, R., Uzzi, B., Vespignani, A., Waltman, L., Wang, D., & Barabási, A.-L. (2018). Science of science. Science, 359(6379), eaao0185. https://doi.org/10.1126/science.aao0185
Rünzel, M., Sarfatti, P., & Negroustoueva, S. (2021). Evaluating quality of science in CGIAR research programs: Use of bibliometrics. Outlook on Agriculture, 50(2), 130–140. https://doi.org/10.1177/00307270211024271


