
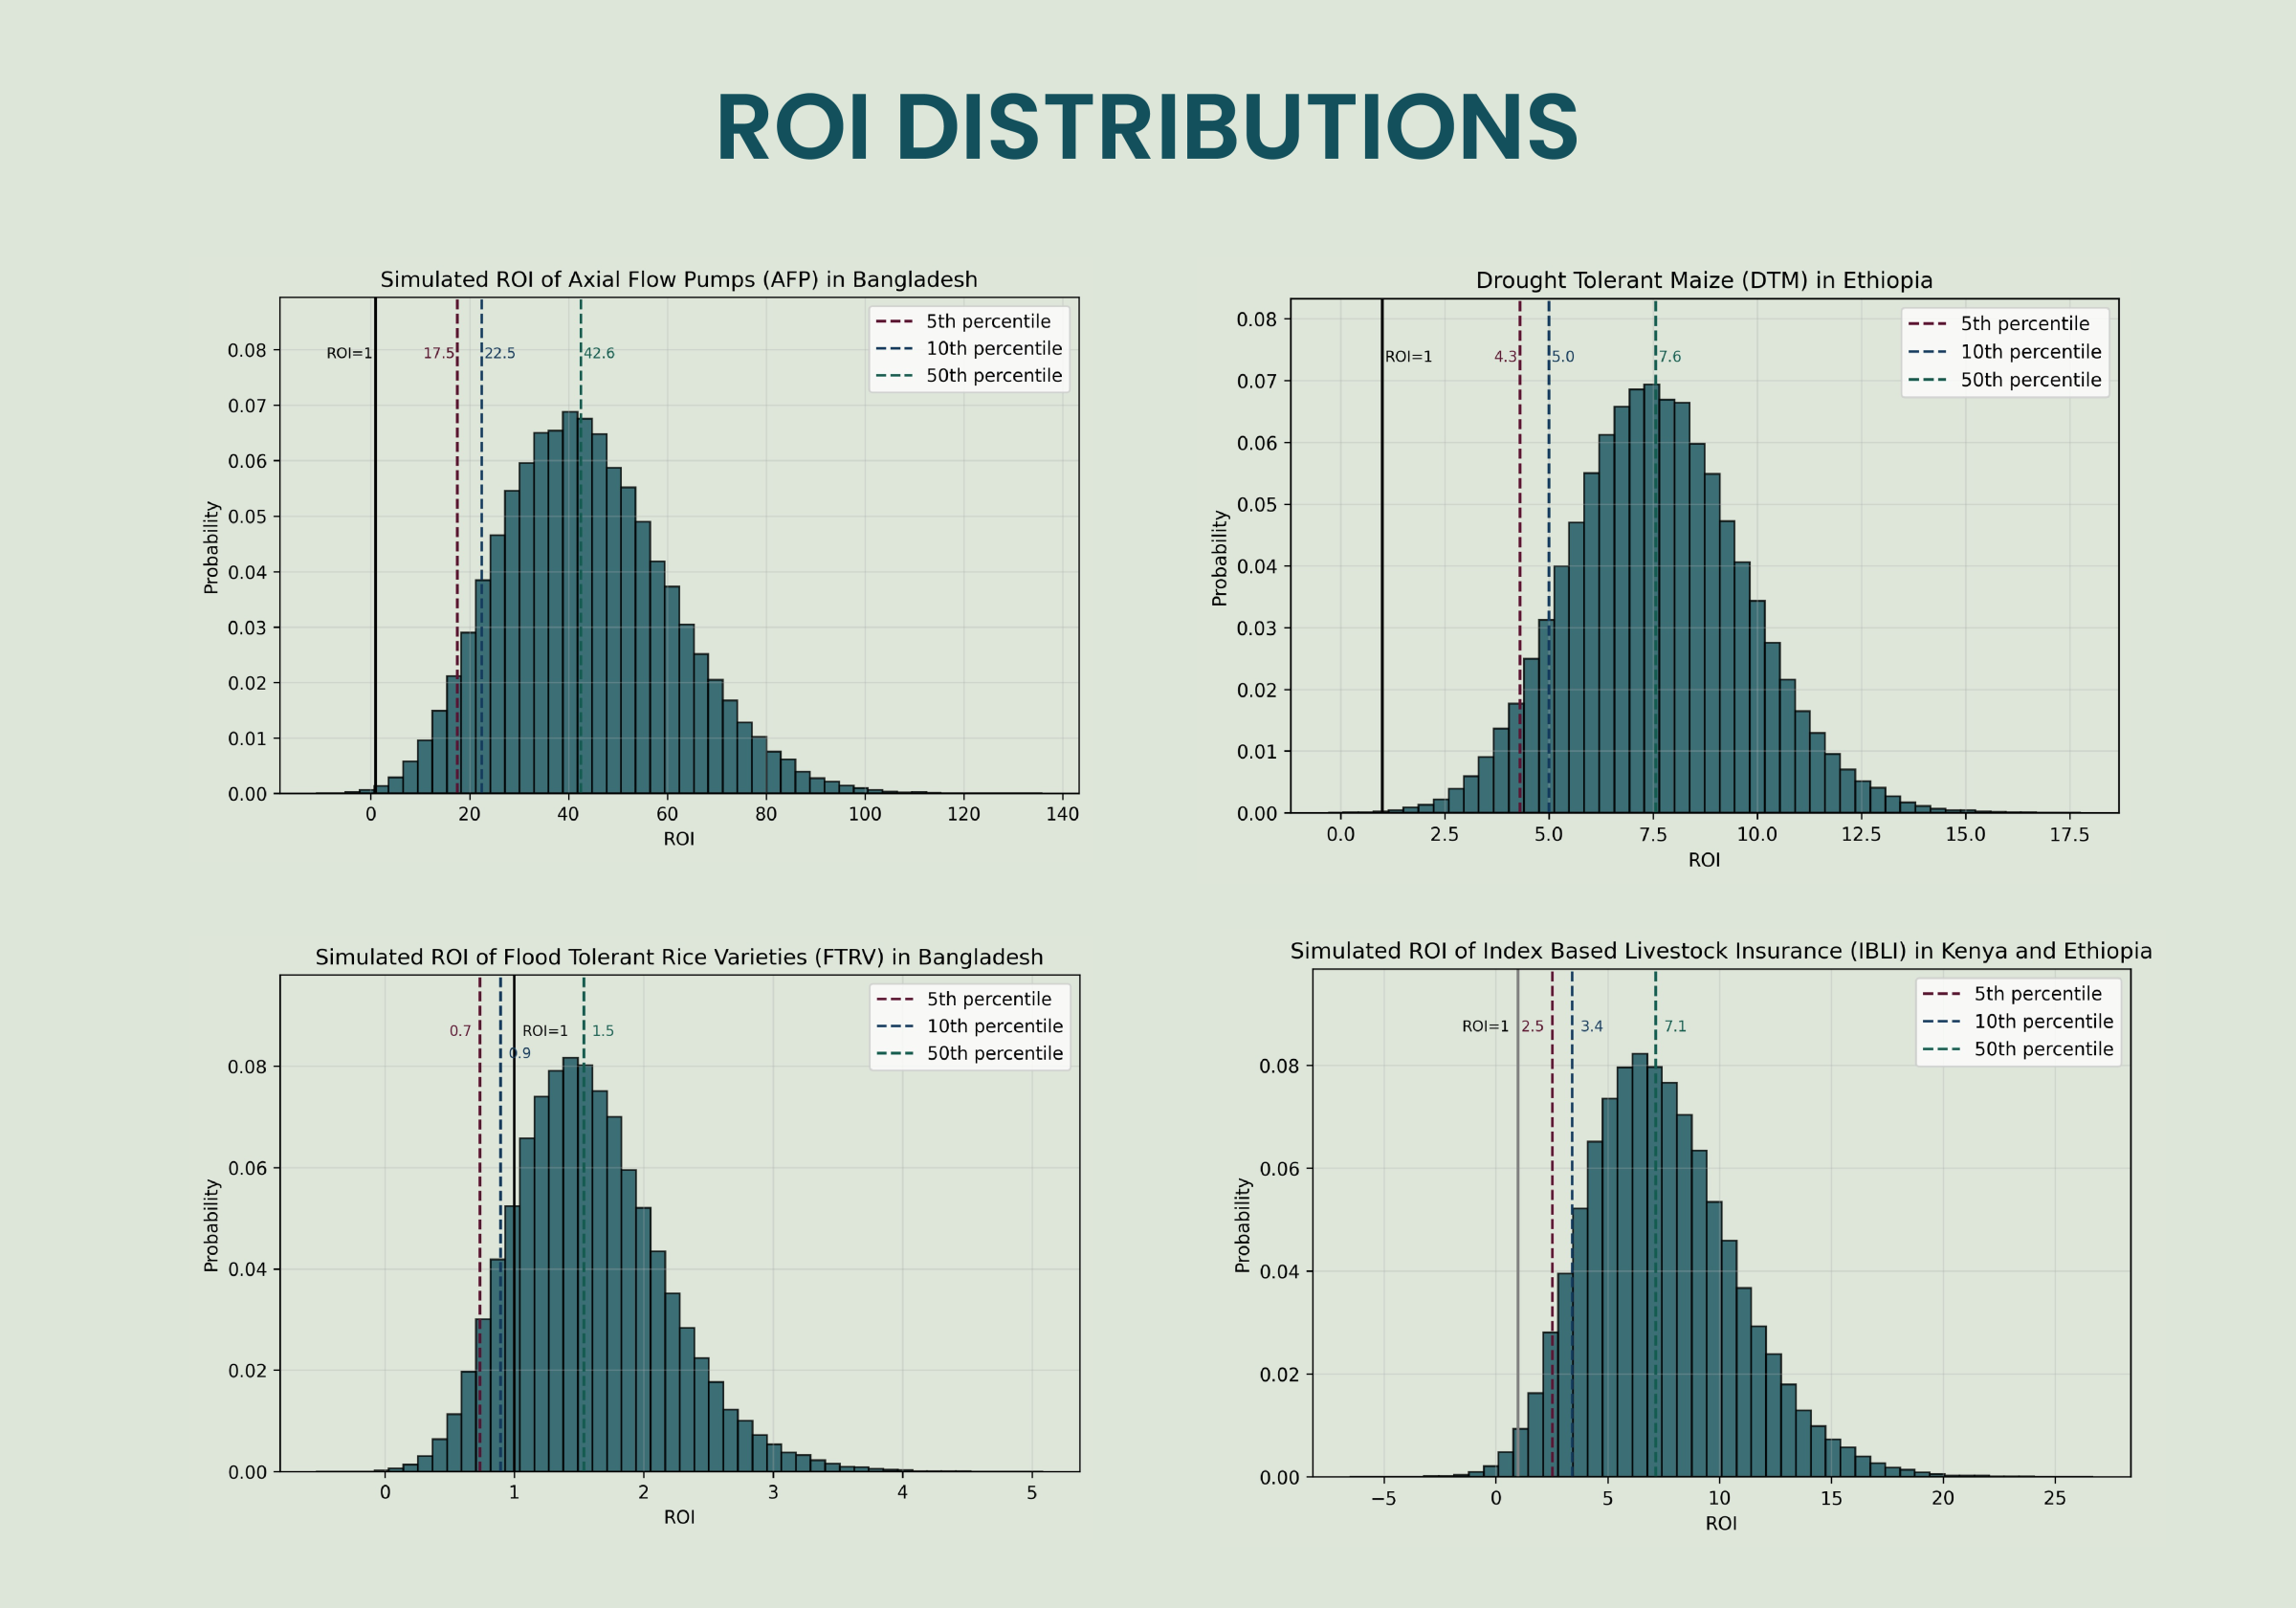
When SPIA presented to stakeholders our estimate that CGIAR's investment in drought-tolerant maize in Ethiopia generated returns between $4.30 and $7.60 for every dollar spent, this raised an obvious question: "Which is it? Those are different numbers."
This is a fair question. A near twofold range isn't trivial. For a funder, it may be the difference between a decent investment and an exceptional one. But what SPIA has learned through the course of this study is that the ROI range is the honest answer.
Every ROI calculation rests on assumptions. When SPIA estimated the ROI for four CGIAR innovations, we encountered many unknowns. At various points we had to make choices that could influence the ultimate ROI number. While these decision points were inevitable, we did not want to gloss over them. Instead, we tracked the choices we made, and considered what would happen if we chose differently. What emerged wasn't a single number, but a distribution that captured the genuine uncertainty of these estimates.
Three Components, Three Problems
The formula for the ROI on a CGIAR innovation appears deceptively simple:

But each of these factors — reach, benefit, and cost — comes with its own set of potential uncertainties.
Costs: The Allocation Problem
Let’s start with the denominator: total CGIAR costs on developing and disseminating an innovation. In theory, this should be straightforward as one simply needs information on how much was spent. But the reality was more complex.
CGIAR centers provided us with cost data for entire projects or programs, in line with standard accounting procedures. However, innovations often cut across many projects. For instance, when we asked a CGIAR center for costs related to Index-Based Livestock Insurance (IBLI), they could tell us what they spent on insurance development projects across Africa. But our ROI calculation focused only on Kenya and Ethiopia. So what share of those broader costs should we have allocated to our case?
After consultation with ILRI, we arrived at a 20% share for projects targeting Africa broadly and 40% for those focused on East Africa or the Horn of Africa. While that may be a reasonable assumption, the percentages could easily have been 15% and 35%, or 25% and 45%, and we would have no way to know which was closer to the truth.
You could even ask if it is ever possible to cleanly apportion costs in this way: some initial development costs are fixed and pivotal to all subsequent work on an innovation, and it is not clear they can be cleanly separated across projects or countries.
Reach: The Verification Problem
The second source of uncertainty came from the estimates of an innovation’s reach. We can't assume an innovation reached everyone in a program's catchment or dissemination area. We can't even assume it reached everyone who participated in the program. Farmers sometimes say they have adopted a technology when they haven't. Or they may plant seeds thinking they are "improved” varieties, but they turn out to be something else entirely.
This is why during 2019-24, SPIA’s country studies in Uganda, Bangladesh, Ethiopia and Vietnam invested heavily in the rigorous measurement of adoption. We conducted and collaborated on representative household surveys with carefully designed questionnaire modules. We used DNA fingerprinting on crop cuts to verify what farmers were actually growing. These methods gave us reliable reach estimates we could trust, with known sampling error we could account for.
Even so, decisions had to be made. When Jensen et al. (2024) estimated the reach of IBLI, they knew how many insurance policies had been sold. What they didn't know was how many unique households those policies represented (if the same household purchases repeatedly, the number of unique beneficiaries is smaller than the number of policies sold). We had to make assumptions, and we wanted to be transparent about the uncertainty.
Benefits: The Lab-to-Field Gap
Finally, there was uncertainty about some of the impact estimates. The conundrum here is twofold: 1) not all impacts are tangible and quantifiable, and 2) not all quantifiable impacts have been credibly quantified for the specific context of interest. Focusing on the second problem, consider the case of axial flow pumps (AFPs) in Bangladesh. Laboratory trials showed these pumps could reduce fuel costs for irrigation service providers. However, other impacts such as its effects on greenhouse gas emissions have not been explicitly studied. Also, how does one extrapolate the findings from these lab trials into realistic estimates, given the absence of real-world trials from Bangladeshi farms?
Thankfully, this is a well-known problem, as we know from the literature on “yield gaps”: where high-yielding varieties tested in ideal settings generally perform below full potential when farmers plant them in their non-experimental plots. Institutional features, market dynamics, and farmer behavior all affect outcomes in ways that controlled trials do not capture. So we borrowed a translation factor from the yield gap in rice cultivation in Bangladesh and applied it to the laboratory results for axial flow pumps, assuming real-world savings would be lower than experimental ones. Our assumption might have been conservative (or not conservative enough), and so we factored in the uncertainty around the “true” translation factor.
Or take the case of flood-tolerant rice varieties (FTRVs). These varieties deliver yield benefits only when rice plants are completely submerged for a very specific duration: not too short and not too long. If they are submerged for a short duration, there is no added benefit from growing the FTRVs. If they are submerged for too long, the plants die, regardless of the variety.
These specific-condition floods happen infrequently, which is tricky for ROI calculation. So when do we count the benefits? And can simple ROI calculations account for the potentially very large welfare benefits when FTRVs reduce farmers’ vulnerability during shocks?
The Solution: Embrace the Distribution
Instead of pretending we could calculate one true ROI, we ran thousands of simulations, varying assumptions about costs, reach, and benefits within reasonable bounds. The resulting distributions show the likelihood of a range of ROIs and reflect the uncertainty. For drought-tolerant maize in Ethiopia, our distribution suggests that there is a 95% chance that every $1 spent generated at least $4.3 worth of benefits, a 90% chance that it generated at least $5.0 of benefits, and a 50% chance that it generated at least $7.6 of benefits.
So when someone asks whether the ROI is $4.30 or $7.60, we suggest changing the question. The ROI is inherently unknown, but some values are more likely than others. Depending on how sure you would like to be, choose your probability threshold, and consider the corresponding ROI estimate. That is not the crisp answer stakeholders may prefer, but it’s the truthful one.
This is Part 2 of a three-part blog series on estimating ROI for CGIAR innovations. Read Part 1: ROI for Agricultural Research: A Two-Stage Framework.
For more information on the four innovations, read SPIA's report: Estimating the Returns on Investment for Select CGIAR Innovations.


